Cow-to-People ratio of every county in Montana
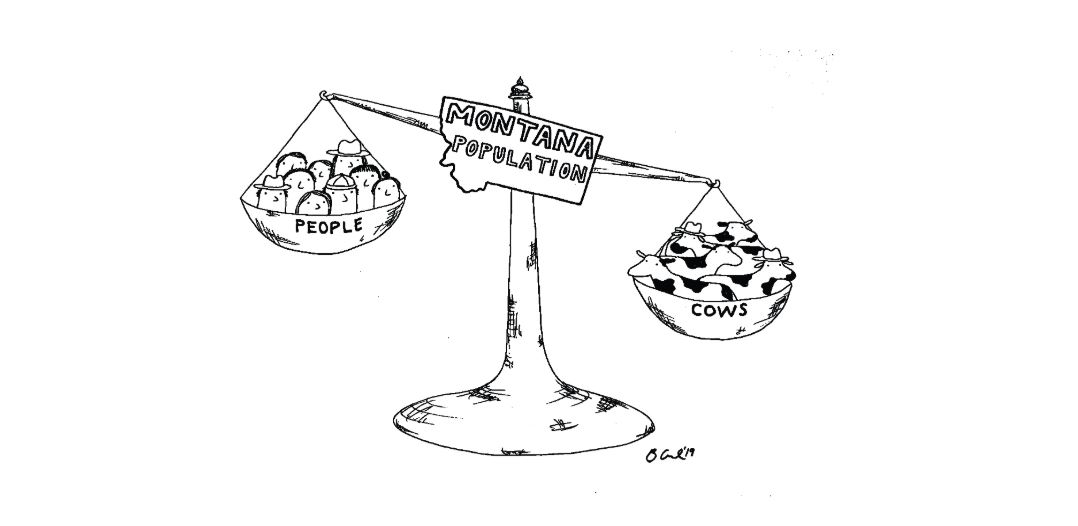
Montana has a reputation of having more cows than people. As it turns out, that reputation is based on reality. According to the U.S. Census Bureau, Montana’s 2018 population is roughly 1,062,305. Yes, folks, we broke one million. According to the 2017 Census of Agriculture, Montana had 2,518,571 cows in 2017. That’s just over 2 cows for every person. To be exact, 2.37085489 per person.
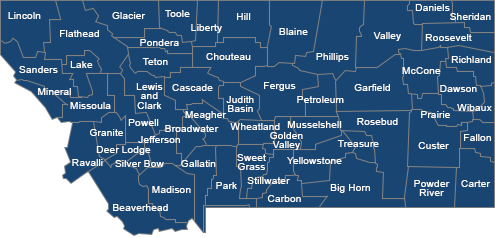
But what does that look like on the ground? Certainly not every county has a 2:1 ratio of cows to people. So we broke it down, county by county, to see where the cattle outnumber the humans in our expansive, 147,000-square mile state.
For instance, Carter County has way more cows than people — 74 cows for every human.
In comparison, humans outnumber bovines in six other Montana counties. See if yours is on the list. We at Prairie Populist are milking the data for all it’s worth.
Take a look:
| County | Cows (2018) | People (2017) | Cows per person |
| Carter County | 91,252 | 1,238 | 74 |
| Garfield County | 74,262 | 1,268 | 59 |
| Powder River County | 84,944 | 1,716 | 50 |
| Prairie County | 48,224 | 1,087 | 44 |
| Petroleum County | 22,138 | 513 | 43 |
| Treasure County | 28,375 | 679 | 42 |
| Judith Basin County | 72,091 | 1,952 | 37 |
| Meagher County | 50,989 | 1,866 | 27 |
| McCone County | 40,349 | 1,675 | 24 |
| Golden Valley County | 16,484 | 826 | 20 |
| Wibaux County | 21,050 | 1,034 | 20 |
| Wheatland County | 43,006 | 2,236 | 19 |
| Phillips County | 76,901 | 4,074 | 19 |
| Fallon County | 46,066 | 2,920 | 16 |
| Beaverhead County | 126,752 | 9,404 | 13 |
| Fergus County | 119,336 | 11,113 | 11 |
| Blaine County | 70,698 | 6,807 | 10 |
| Rosebud County | 91,559 | 9,063 | 10 |
| Sweet Grass County | 33,529 | 3,710 | 9 |
| Madison County | 80,763 | 8,768 | 9 |
| Daniels County | 14,412 | 1,747 | 8 |
| Musselshell County | 38,861 | 4,651 | 8 |
| Valley County | 61,831 | 7,437 | 8 |
| Custer County | 90,952 | 11,586 | 8 |
| Chouteau County | 37,644 | 5,745 | 7 |
| Teton County | 46,002 | 6,162 | 7 |
| Carbon County | 78,558 | 10,714 | 7 |
| Granite County | 19,392 | 3,378 | 6 |
| Richland County | 63,288 | 10,913 | 6 |
| Big Horn County | 83,734 | 13,338 | 6 |
| Sheridan County | 17,651 | 3,424 | 5 |
| Powell County | 35,243 | 6,968 | 5 |
| Stillwater County | 46,755 | 9,534 | 5 |
| Liberty County | 10,245 | 2,430 | 4 |
| Toole County | 18,245 | 4,853 | 4 |
| Pondera County | 24,285 | 5,972 | 4 |
| Broadwater County | 23,154 | 6,085 | 4 |
| Dawson County | 36,427 | 8,680 | 4 |
| Glacier County | 43,839 | 13,747 | 3 |
| Roosevelt County | 27,228 | 11,059 | 2 |
| Jefferson County | 24,879 | 12,097 | 2 |
| Park County | 37,099 | 16,736 | 2 |
| Lake County | 56,119 | 30,250 | 2 |
| Deer Lodge County | 7,361 | 9,131 | 1 |
| Sanders County | 15,539 | 11,844 | 1 |
| Hill County | 16,826 | 16,347 | 1 |
| Ravalli County | 27,032 | 43,172 | 1 |
| Lewis and Clark County | 40,202 | 68,700 | 1 |
| Cascade County | 64,816 | 81,643 | 1 |
| Yellowstone County | 110,710 | 160,137 | 1 |
| Mineral County | 438 | 4,316 | 0 |
| Lincoln County | 2,101 | 19,794 | 0 |
| Silver Bow County | 3,679 | 34,993 | 0 |
| Flathead County | 8,441 | 102,106 | 0 |
| Gallatin County | 41,043 | 111,876 | 0 |
| Missoula County | 5,772 | 118,791 | 0 |
-Amanda Garant
Data Sources:
Human Population Data: 2018 U.S. Census Estimates. https://www.census.gov/quickfacts/fact/map/mt/PST045218
Cow Population Data: 2017 Ag Census. https://www.nass.usda.gov/Publications/AgCensus/2017/Full_Report/Volume_1,_Chapter_2_County_Level/Montana/st30_2_0011_0011.pdf
Got something to say to Prairie Populist? Send news tips, story ideas and comments to [email protected]. If you have something to submit, or an idea for a story you’d like to write for us, check out our Submission Guidelines here.